


MarketRadar read: neutral
Markets are closed for the weekend — time to review the week that was (October 26–30, 2026) and map the levels that matter for the week ahead. This edition covers three markets — gold (XAUUSD), Bitcoin (BTCUSD) and EUR/USD — with five sessions of price action, daily-chart levels, marked charts, and the fundamental themes carrying into next week.
Gold (XAUUSD) — levels for the week ahead
Week range 3,884.00–4,077.87, week-end last daily close 3,892.84 (-2.93% on the week). Daily bias: bearish. Resistance above: 3,900.00, 3,925.00, 3,950.00. Support below: 3,875.00, 3,850.00, 3,825.00. Supply zone 4,057.17–4,098.57; demand zone 3,863.30–3,904.70.
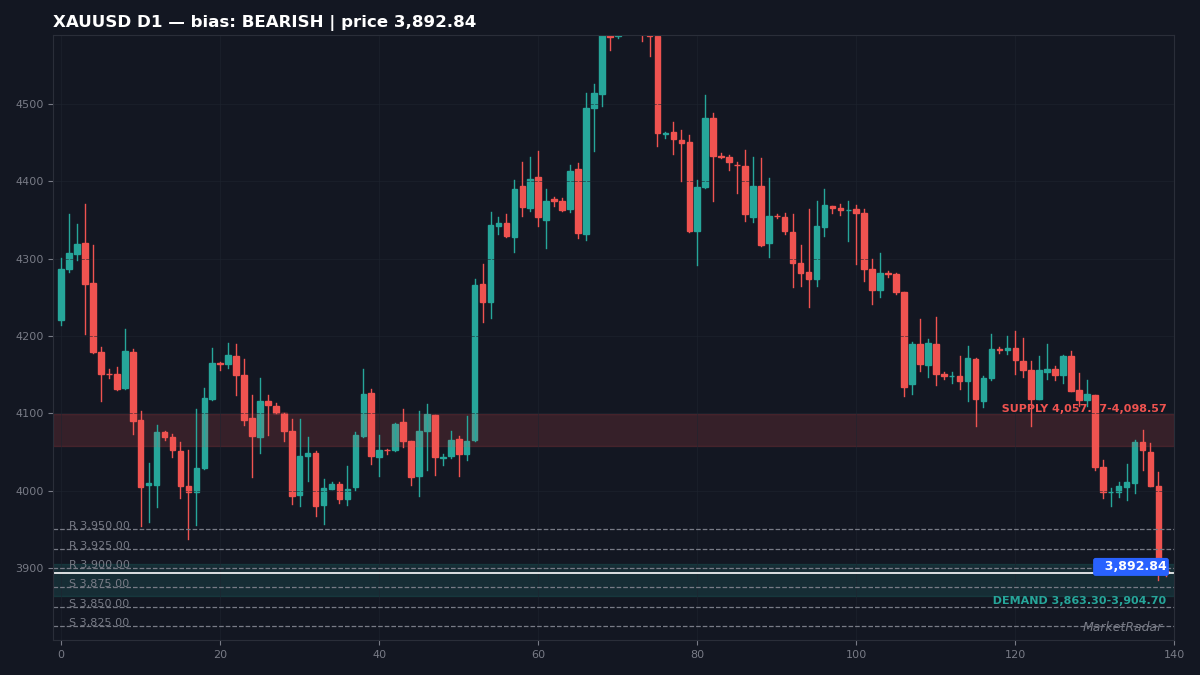
D1 — XAUUSD daily
Price 3,892.84 — structure favors sellers on the daily chart (50-period average 4,174.35, ATR 51.76). Resistance: 3,900.00, 3,925.00, 3,950.00. Support: 3,875.00, 3,850.00, 3,825.00. Supply zone 4,057.17–4,098.57; demand zone 3,863.30–3,904.70.
H4 — XAUUSD 4-hour
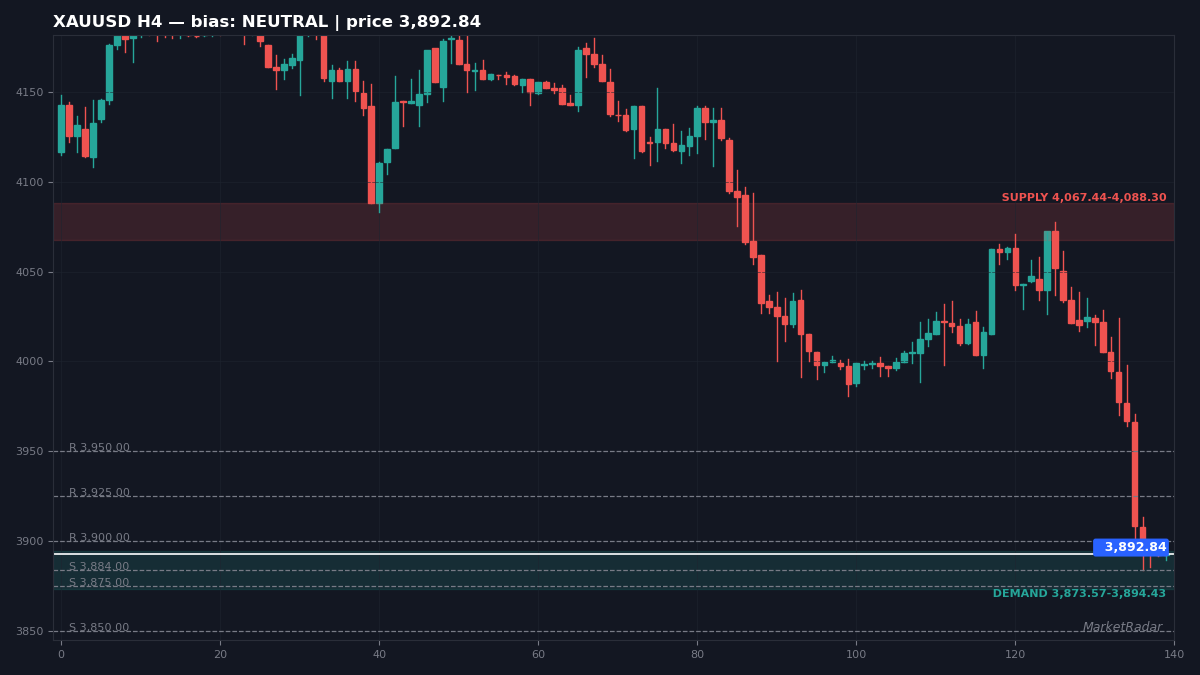
At 3,892.84, no clear directional edge on the 4-hour timeframe (50-period average 4,005.33, ATR 26.09). Overhead hurdles: 3,900.00, 3,925.00, 3,950.00. Downside cushions: 3,884.00, 3,875.00, 3,850.00. Overhead supply sits at 4,067.44–4,088.30, with demand at 3,873.57–3,894.43.
On the hourly chart, price 3,892.84 trades below the 50-period average at 3,971.42; 3,899.30 caps the upside and 3,884.00 floors it — the intraday map for Monday's open.
Key levels — XAUUSD
| Level | Type | Spotted on |
|---|---|---|
| 3,950.00 | Resistance | D1 |
| 3,925.00 | Resistance | D1 |
| 3,900.00 | Resistance | D1 |
| 3,899.30 | Resistance | H1 |
| 3,898.20 | Resistance | M15 |
| 3,895.93 | Resistance | M15 |
| 3,891.55 | Support | M15 |
| 3,889.50 | Support | M15 |
Bitcoin (BTCUSD) — levels for the week ahead
77,173 is the week-end last daily close — -3.54% over five sessions that spanned 76,156–81,882. The daily chart reads neutral heading into next week.
Overhead supply sits at 78,000, 79,000, 80,000; underneath, 77,000, 76,000, 75,000. The week's supply shelf spans 84,050–85,630, its demand shelf 75,366–76,945.
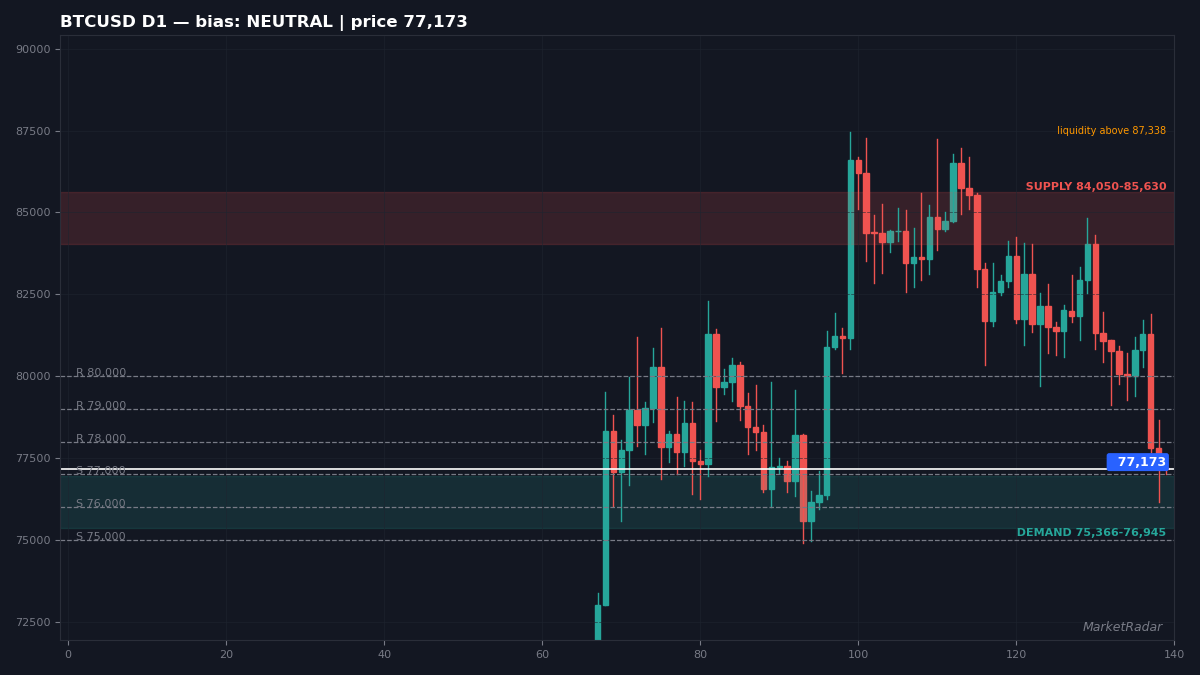
D1 — BTCUSD daily
The daily picture at 77,173 shows no clear directional edge (50-period average 81,890, ATR 1,975). Resistance: 78,000, 79,000, 80,000. Support: 77,000, 76,000, 75,000. Buy-side liquidity sits above 87,338. The supply shelf: 84,050–85,630; the demand shelf: 75,366–76,945.
H4 — BTCUSD 4-hour
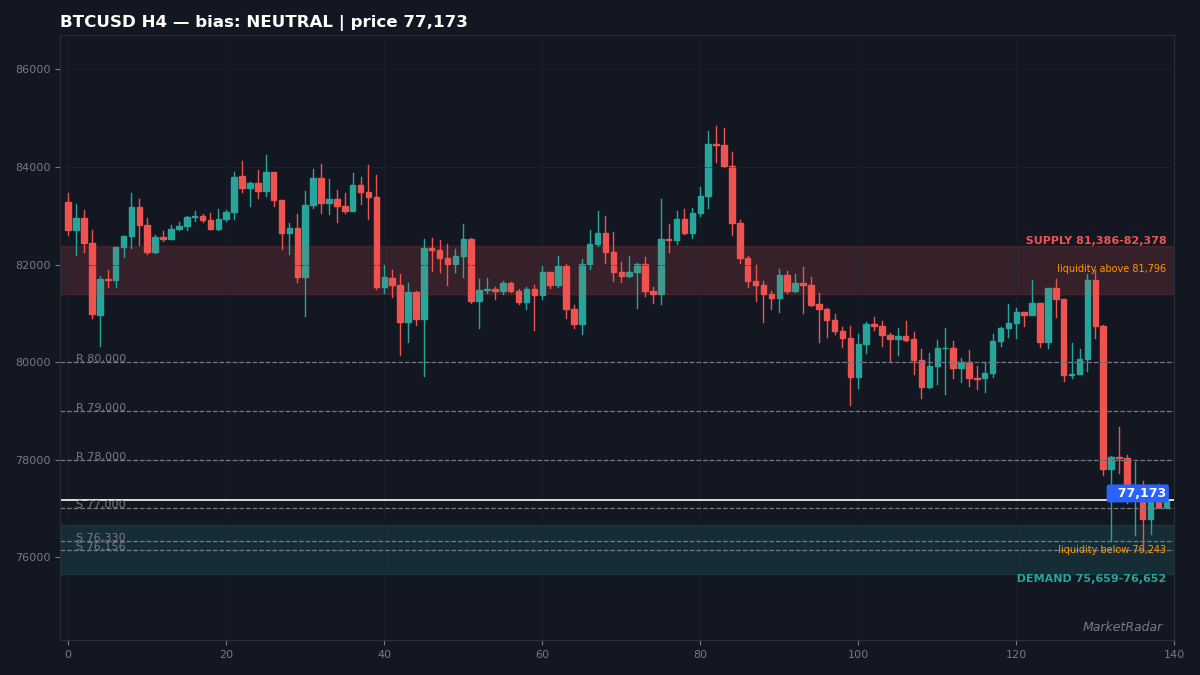
77,173 on the 4-hour chart shows no clear directional edge (50-period average 80,010, ATR 1,240). Overhead hurdles: 78,000, 79,000, 80,000. Downside cushions: 77,000, 76,330, 76,156. Buyers' liquidity pools above 81,796. Sellers' liquidity pools below 76,243. Supply overhead at 81,386–82,378; demand underneath at 75,659–76,652.
Hourly structure in one line: 77,173 against a 78,399 average, first resistance 77,494, first support 77,000.
Key levels — BTCUSD
| Level | Type | Spotted on |
|---|---|---|
| 80,000 | Resistance | D1 |
| 79,000 | Resistance | D1 |
| 78,000 | Resistance | D1 |
| 77,947 | Resistance | H1 |
| 77,494 | Resistance | H1 |
| 77,111 | Support | M15 |
| 77,000 | Support | D1 |
| 76,469 | Support | M15 |
Euro / US Dollar (EURUSD) — levels for the week ahead
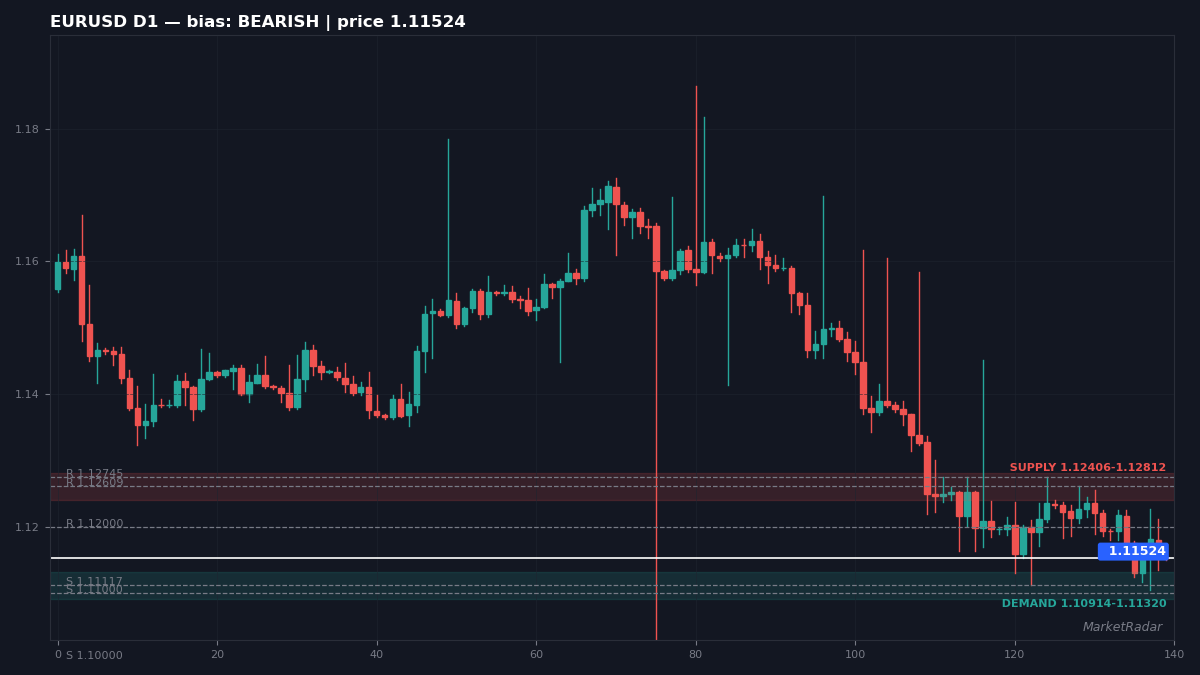
Daily bias: bearish. Zones first: supply 1.12406–1.12812, demand 1.10914–1.11320.
That framing comes from a 1.11045–1.12262 week-range and a 1.11524 week-end last daily close, -0.20% on the week. Resistance above: 1.12000, 1.12609, 1.12745. Support below: 1.11117, 1.11000, 1.10000.
D1 — EURUSD daily
On the daily chart, 1.11524 shows structure favors sellers (50-period average 1.12979, ATR 0.00507). Resistance: 1.12000, 1.12609, 1.12745. Support: 1.11117, 1.11000, 1.10000. Sellers defend supply at 1.12406–1.12812; buyers defend demand at 1.10914–1.11320.
H4 — EURUSD 4-hour
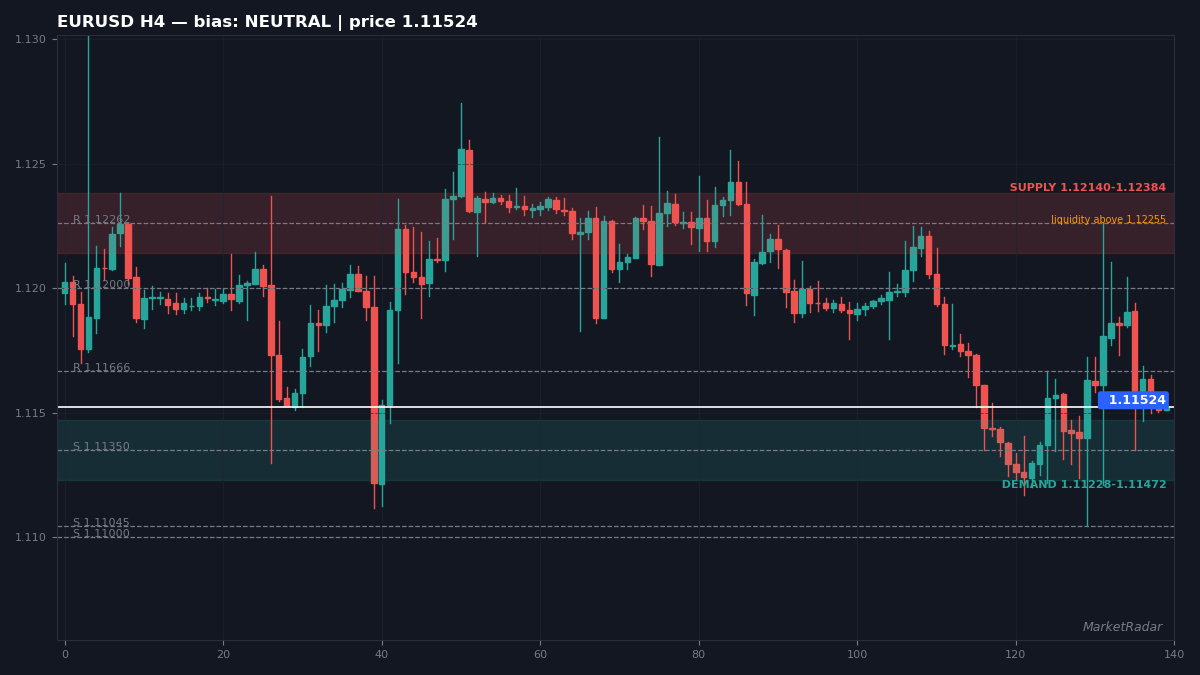
The 4-hour picture at 1.11524 shows no clear directional edge (50-period average 1.11739, ATR 0.00306). Overhead hurdles: 1.11666, 1.12000, 1.12262. Downside cushions: 1.11350, 1.11045, 1.11000. Buyers' liquidity pools above 1.12255. The 4-hour supply zone is 1.12140–1.12384; demand is 1.11228–1.11472.
The 1-hour view into the weekend: 1.11524, below its 1.11624 average — 1.11500 is the first line to defend, 1.12000 the first to crack.
Key levels — EURUSD
| Level | Type | Spotted on |
|---|---|---|
| 1.12745 | Resistance | D1 |
| 1.12609 | Resistance | D1 |
| 1.12262 | Resistance | H4 |
| 1.12107 | Resistance | H1 |
| 1.12045 | Resistance | H1 |
| 1.12000 | Resistance | D1 |
| 1.11671 | Resistance | M15 |
| 1.11666 | Resistance | H4 |
Fundamentals — last week's impact
- Breaking: Gold crashes below $3,900 to hit a one-year low — FXStreet
- Crypto exchanges call for quick moves to bolster defenses after Binance heist — Investing.com
Inflation set the tone twice last week. September CPI came in hot at 3.7% year on year, core 2.6%, and gasoline alone rose 9.1% in a single month — over half the monthly rise. September PPI followed at 6.3% year on year, the fastest annual pace since December 2022. Against that, September payrolls added just 29K jobs against 90K expected, a dovish miss arguing the other way. The Fed stays in a tightening stance after its 25bp hike on September 16, 2026, so each fresh inflation surprise now feeds straight into hike pricing rather than cut hopes, and that repricing runs through all three markets above.
Week ahead — November 02–06, 2026
This outlook is for Monday November 02 to Friday November 06, 2026. The week-in-review figures above (October 26–30, 2026) are background for how these levels were set.
The October 27-28 meeting has since concluded: the benchmark was held at 3.75%-4% on October 28 in a 10-2 vote, with Lisa Cook and Beth Hammack preferring a 25bp hike. December 8-9 is next on the calendar, and market pricing put a December hike near 83% (as of October 29, 2026 (post PCE/GDP data)) — the inflation prints, not the soft payrolls, set expectations for that meeting. Until the Fed speaks again, the levels above do the talking: a daily last close through resistance or under support votes early.
- XAUUSD: first hurdle 3,900.00, first floor 3,875.00 — the daily last close decides.
- BTCUSD: first resistance 78,000, first support 77,000 — a daily close above resistance or below support decides.
- EURUSD: first ceiling 1.12000, first base 1.11117 — the next daily last close decides.
The honest frame for next week: trends persist until a daily last close proves otherwise. Watch whether gold holds above its demand zone, whether Bitcoin reclaims its nearest resistance, and whether EUR/USD keeps its bearish structure. Those three answers set the tone.
A final note
This content is for educational purposes only and is not financial advice. Trading involves risk. Always do your own research before making any decision.


