
MarketRadar read: neutral
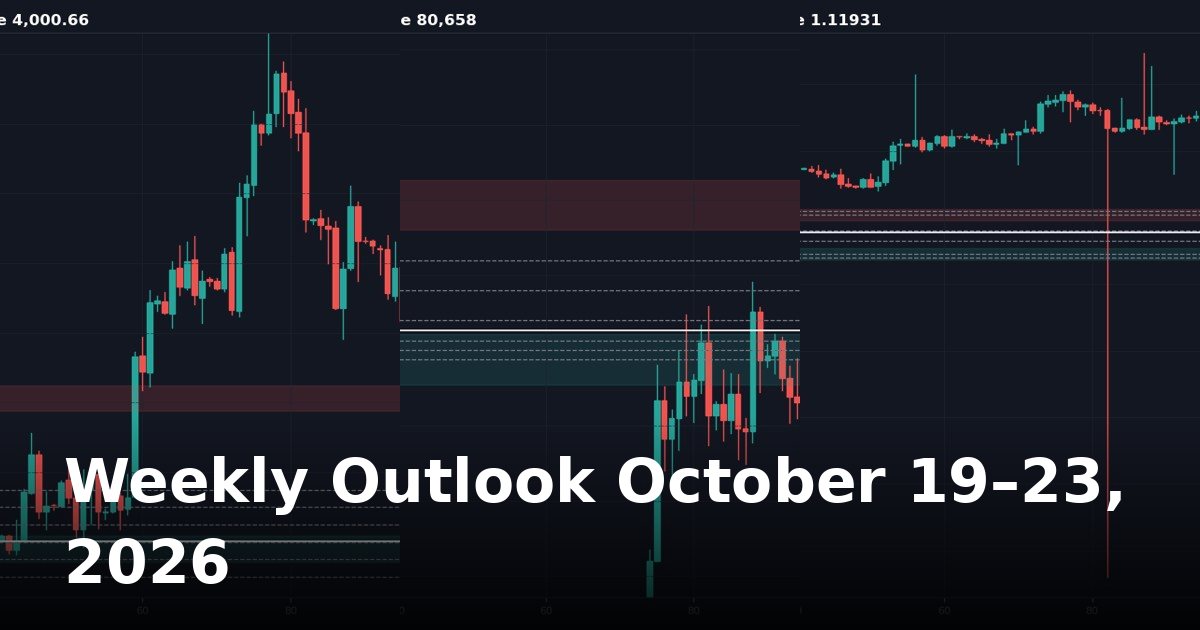
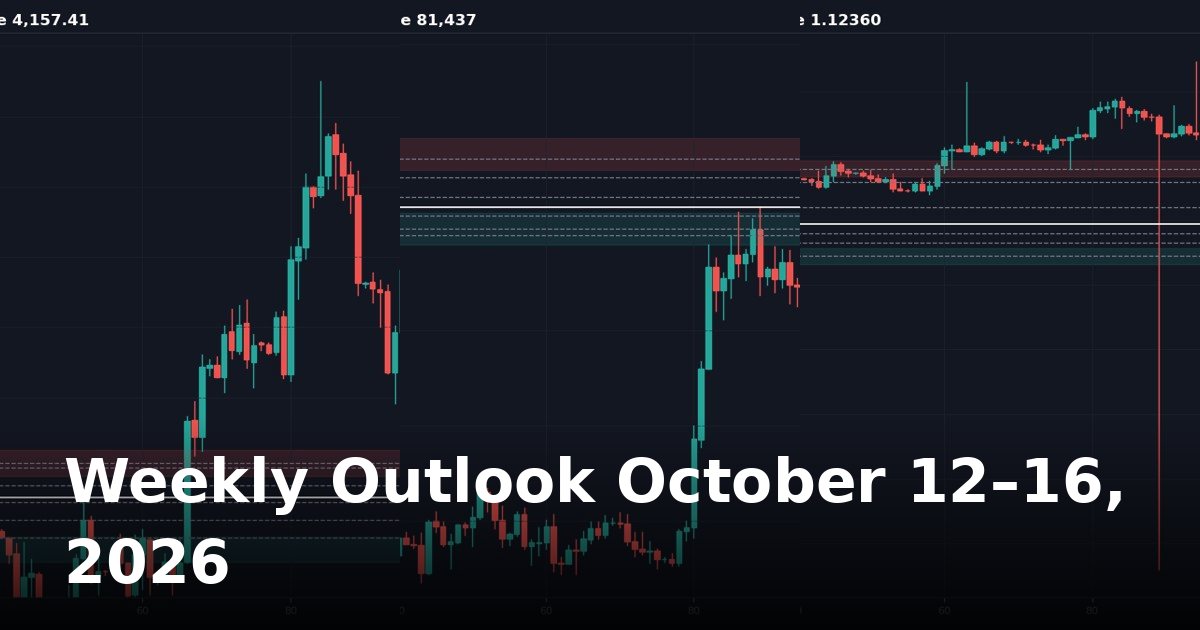
Markets are closed for the weekend — time to review the week that was (October 12–16, 2026) and map the levels that matter for the week ahead. This outlook covers gold (XAUUSD), Bitcoin (BTCUSD) and EUR/USD: weekly price action, daily-chart levels with marked charts, and the fundamental themes carrying into next week.
Gold (XAUUSD) — week in review
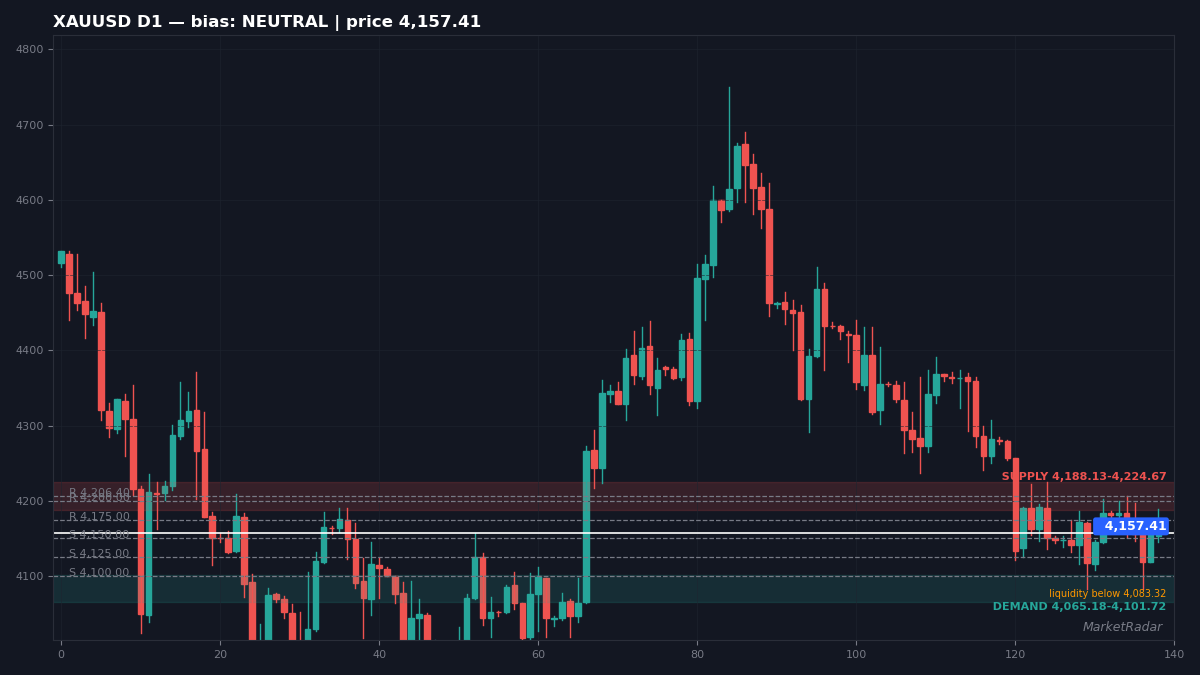
Week range 4,083.45–4,196.94, close 4,157.41 (-0.25% on the week). Daily bias: neutral. Resistance above: 4,175.00, 4,200.00, 4,206.40. Support below: 4,150.00, 4,125.00, 4,100.00. Supply zone 4,188.13–4,224.67; demand zone 4,065.18–4,101.72.
The last daily candle closed at 4,157.00, higher by +0.01%, after trading between 4,144.93 and 4,189.30.
That is closing inside the previous session's range — no clear winner into the close. The close sits below the 50-period average at 4,278.74.
D1 — XAUUSD daily
Price 4,157.41 — no clear directional edge on the daily chart (50-period average 4,278.74, ATR 45.67). Resistance: 4,175.00, 4,200.00, 4,206.40. Support: 4,150.00, 4,125.00, 4,100.00. Sell-side liquidity rests below 4,083.32. Supply zone 4,188.13–4,224.67; demand zone 4,065.18–4,101.72. Daily closes carry the most weight — when D1 and H4 agree, the move usually has legs.
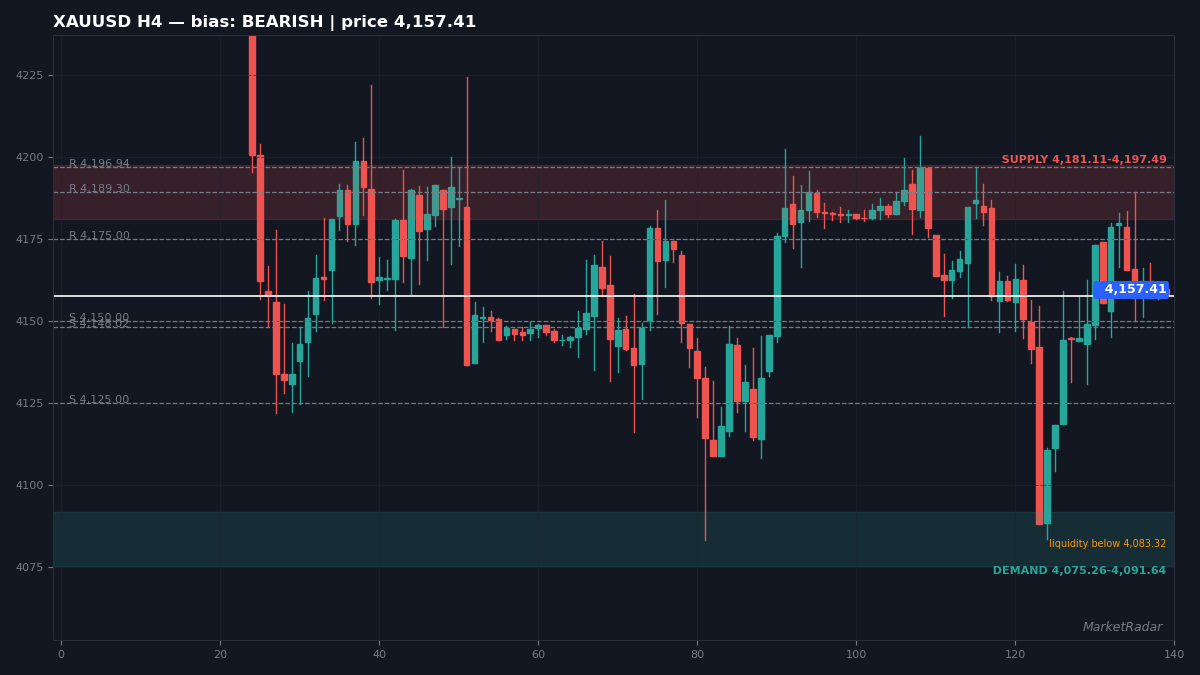
H4 — XAUUSD 4-hour
At 4,157.41, structure favors sellers on the 4-hour timeframe (50-period average 4,167.41, ATR 20.47). Overhead hurdles: 4,175.00, 4,189.30, 4,196.94. Downside cushions: 4,150.00, 4,148.02, 4,125.00. Sellers' liquidity pools below 4,083.32. Overhead supply sits at 4,181.11–4,197.49, with demand at 4,075.26–4,091.64. The swing trader's execution timeframe.
On the hourly chart, price 4,157.41 trades below the 50-period average at 4,159.77; 4,159.79 caps the upside and 4,156.76 floors it — the intraday map for Monday's open.
Key levels — XAUUSD
| Level | Type | Spotted on |
|---|---|---|
| 4,206.40 | Resistance | D1 |
| 4,200.00 | Resistance | D1 |
| 4,196.94 | Resistance | H4 |
| 4,189.30 | Resistance | H4 |
| 4,175.00 | Resistance | D1 |
| 4,167.61 | Resistance | H1 |
| 4,159.79 | Resistance | H1 |
| 4,157.68 | Resistance | M15 |
Bitcoin (BTCUSD) — week in review
81,437 is where the week ended — -0.37% over five sessions that spanned 79,709–84,053. The daily chart reads neutral heading into next week.
Overhead supply sits at 82,000, 83,000, 84,000; underneath, 81,000, 80,329, 80,000. The week's supply shelf spans 83,415–85,085, its demand shelf 79,493–81,164.
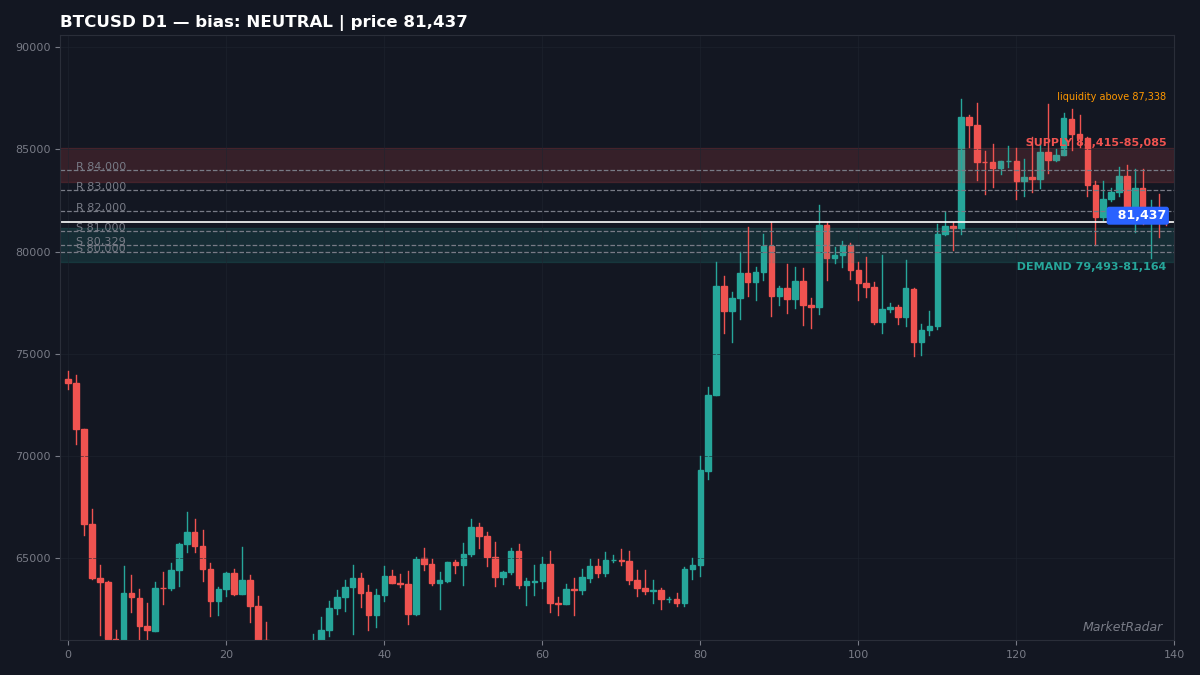
The last daily candle closed at 81,501, lower by -0.08%, after trading between 80,705 and 82,826.
That is closing inside the previous session's range — no clear winner into the close. The close sits above the 50-period average at 81,323.
D1 — BTCUSD daily
Price 81,437 — no clear directional edge on the daily chart (50-period average 81,323, ATR 2,089). Resistance: 82,000, 83,000, 84,000. Support: 81,000, 80,329, 80,000. Buy-side liquidity sits above 87,338. The supply shelf: 83,415–85,085; the demand shelf: 79,493–81,164. Daily closes carry the most weight — when D1 and H4 agree, the move usually has legs.
H4 — BTCUSD 4-hour
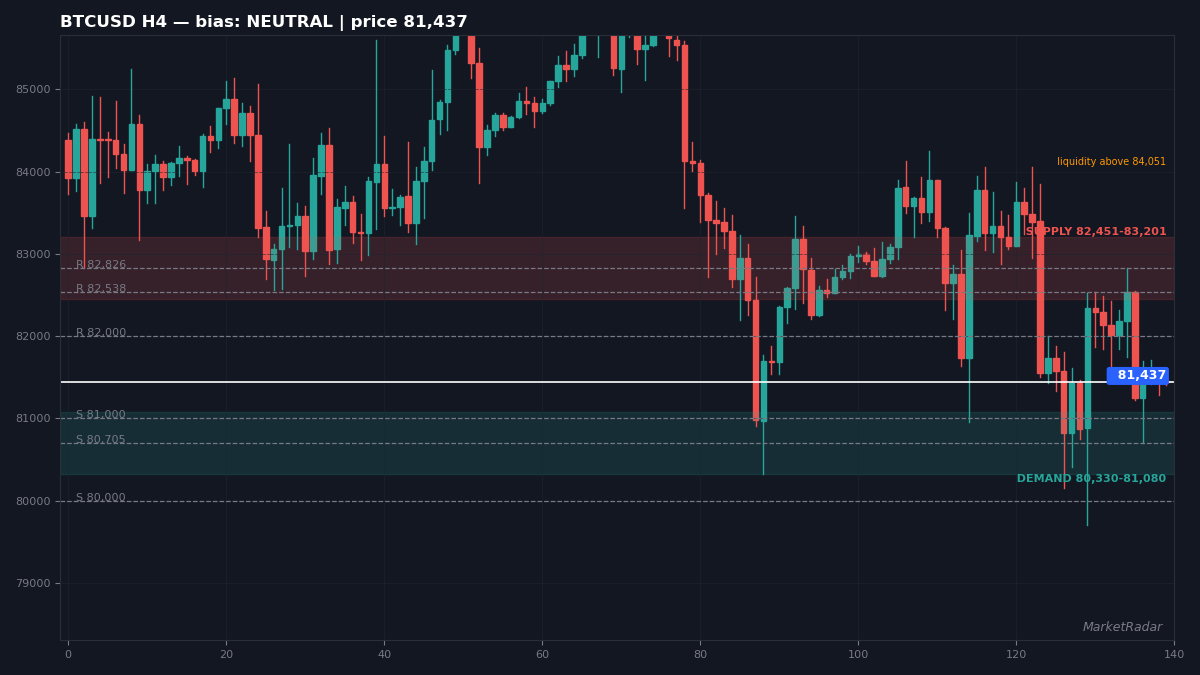
At 81,437, no clear directional edge on the 4-hour timeframe (50-period average 82,587, ATR 937). Overhead hurdles: 82,000, 82,538, 82,826. Downside cushions: 81,000, 80,705, 80,000. Buyers' liquidity pools above 84,051. Supply overhead at 82,451–83,201; demand underneath at 80,330–81,080. The swing trader's execution timeframe.
Hourly structure in one line: 81,437 against a 81,660 average, first resistance 81,715, first support 81,290.
Key levels — BTCUSD
| Level | Type | Spotted on |
|---|---|---|
| 84,000 | Resistance | D1 |
| 83,000 | Resistance | D1 |
| 82,826 | Resistance | H4 |
| 82,538 | Resistance | H4 |
| 82,000 | Resistance | D1 |
| 81,715 | Resistance | H1 |
| 81,525 | Resistance | M15 |
| 81,503 | Resistance | M15 |
Euro / US Dollar (EURUSD) — week in review
Daily bias: bearish. Zones first: supply 1.14216–1.14808, demand 1.10821–1.11413.
That framing comes from a 1.11117–1.12745 week-range and a 1.12360 close, +0.70% on the week. Resistance above: 1.13000, 1.14000, 1.14512. Support below: 1.12000, 1.11629, 1.11117.
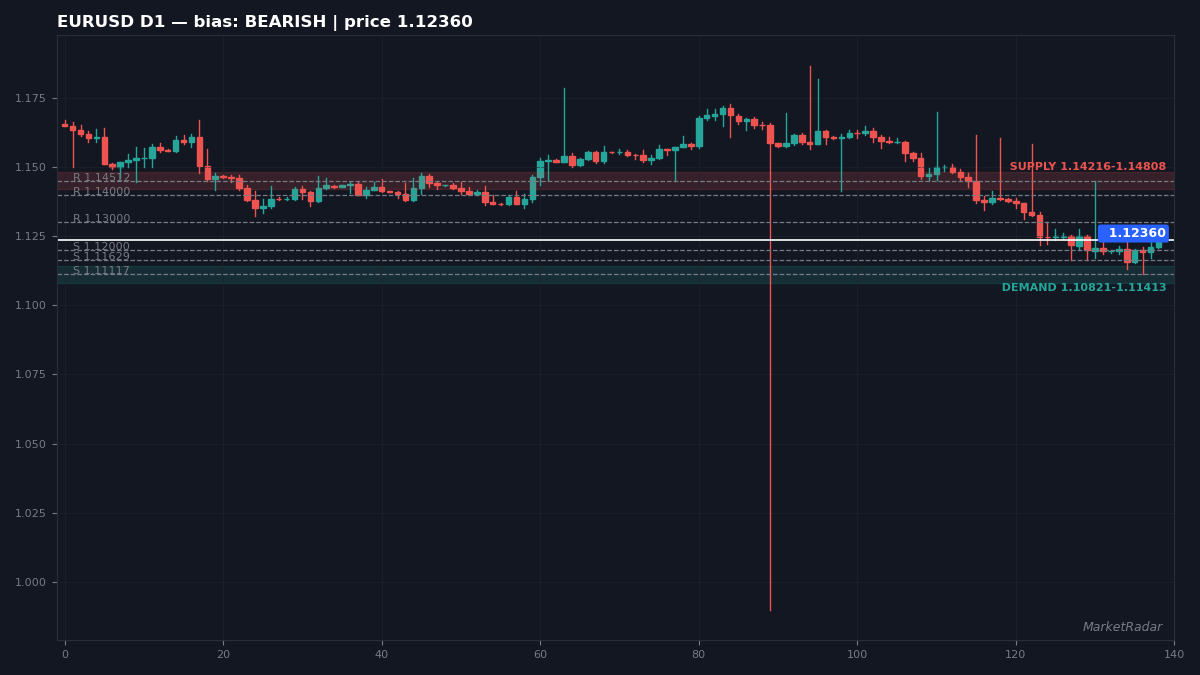
The last daily candle closed at 1.12348, higher by +0.01%, after trading between 1.12068 and 1.12745.
That is closing inside the previous session's range — no clear winner into the close. The close sits below the 50-period average at 1.14144.
D1 — EURUSD daily
Price 1.12360 — structure favors sellers on the daily chart (50-period average 1.14144, ATR 0.00741). Resistance: 1.13000, 1.14000, 1.14512. Support: 1.12000, 1.11629, 1.11117. Sellers defend supply at 1.14216–1.14808; buyers defend demand at 1.10821–1.11413. Daily closes carry the most weight — when D1 and H4 agree, the move usually has legs.
H4 — EURUSD 4-hour
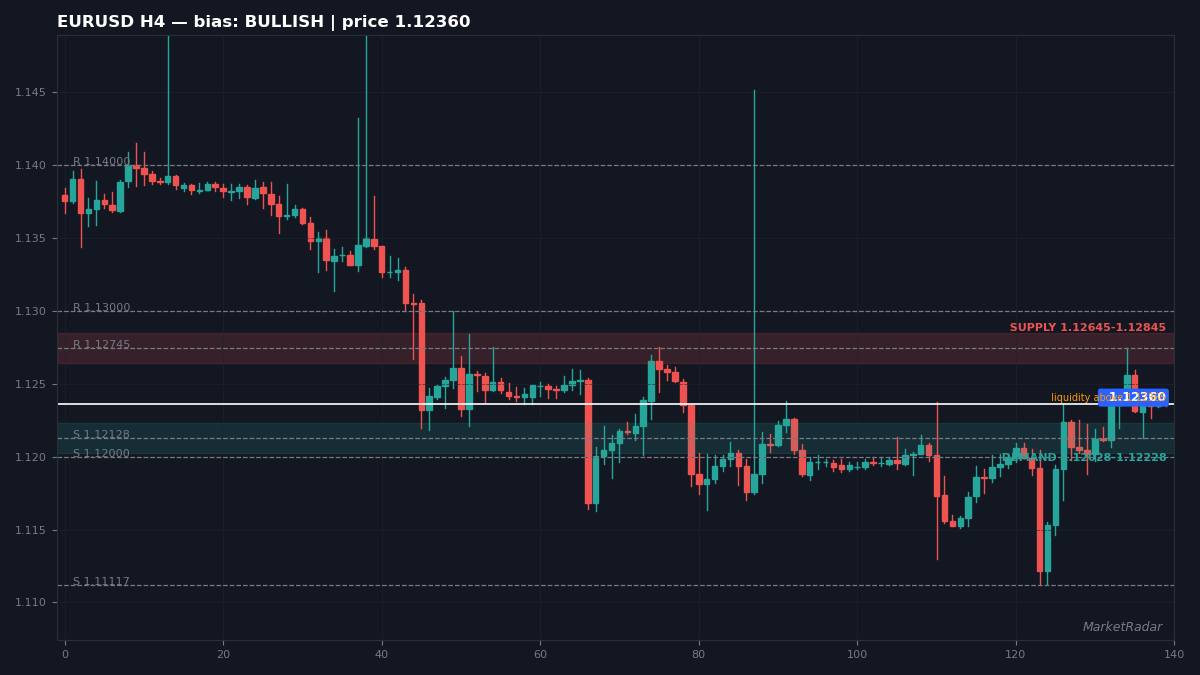
At 1.12360, structure favors buyers on the 4-hour timeframe (50-period average 1.11998, ATR 0.00251). Overhead hurdles: 1.12745, 1.13000, 1.14000. Downside cushions: 1.12128, 1.12000, 1.11117. Buyers' liquidity pools above 1.12365. The 4-hour supply zone is 1.12645–1.12845; demand is 1.12028–1.12228. The swing trader's execution timeframe.
The 1-hour view into the weekend: 1.12360, above its 1.12258 average — 1.12268 is the first line to defend, 1.12384 the first to crack.
Key levels — EURUSD
| Level | Type | Spotted on |
|---|---|---|
| 1.14512 | Resistance | D1 |
| 1.14000 | Resistance | D1 |
| 1.13000 | Resistance | D1 |
| 1.12385 | Resistance | H1 |
| 1.11117 | Support | D1 |
Fundamentals — last week's impact
- Gold set for a weekly drop as traders assess Fed signals — ET Markets
- Gold (XAU/USD) Price Forecast: Bulls Face Crucial $4,226 Resistance - FXEmpire — FXEmpire
- Global markets: Stocks slip as dollar heads for weekly loss — ET Markets
The week's fundamental story was inflation, twice over. September CPI printed hot at 3.7% year on year (core 2.6%), with gasoline up 9.1% in a single month — over half the monthly rise; September PPI followed at 6.3% year on year, the fastest annual pace since December 2022; against that, September payrolls added just 29K jobs against 90K expected — a dovish miss arguing the other way. The Fed's stance stays hawkish / tightening cycle after its 25bp HIKE on 2026-09-16, so every inflation surprise now feeds straight into hike pricing rather than cut hopes — that repricing is the thread running through all three markets above.
Standing macro backdrop: the Fed's stance is hawkish / tightening cycle; after a 25bp HIKE on 2026-09-16; September NFP printed 29,000 vs 90,000 consensus — a big dovish miss. (MarketRadar macro desk, updated 2026-10-17.)
Week ahead — what to expect
The next Fed meeting lands October 27-28, with a December 8-9 meeting behind it. After the hot CPI and PPI pair, Friday's market pricing put an October hike near 17% and a December hike near 89% (MarketRadar macro desk) — the inflation prints, not the soft payrolls, are driving expectations into the meeting. Until the Fed speaks, the levels above do the talking: a daily close through resistance or under support is the market voting early.
- XAUUSD: first hurdle 4,175.00, first floor 4,150.00 — the daily close decides.
- BTCUSD: first hurdle 82,000, first floor 81,000 — the daily close decides.
- EURUSD: first hurdle 1.13000, first floor 1.12000 — the daily close decides.
The honest frame for next week: trends persist until a daily close proves otherwise. Watch whether gold holds above its demand zone, whether Bitcoin reclaims its nearest resistance, and whether EUR/USD keeps its higher-low structure. Those three answers set the tone.
A final note
This content is for educational purposes only and is not financial advice. Trading involves risk. Always do your own research before making any decision.