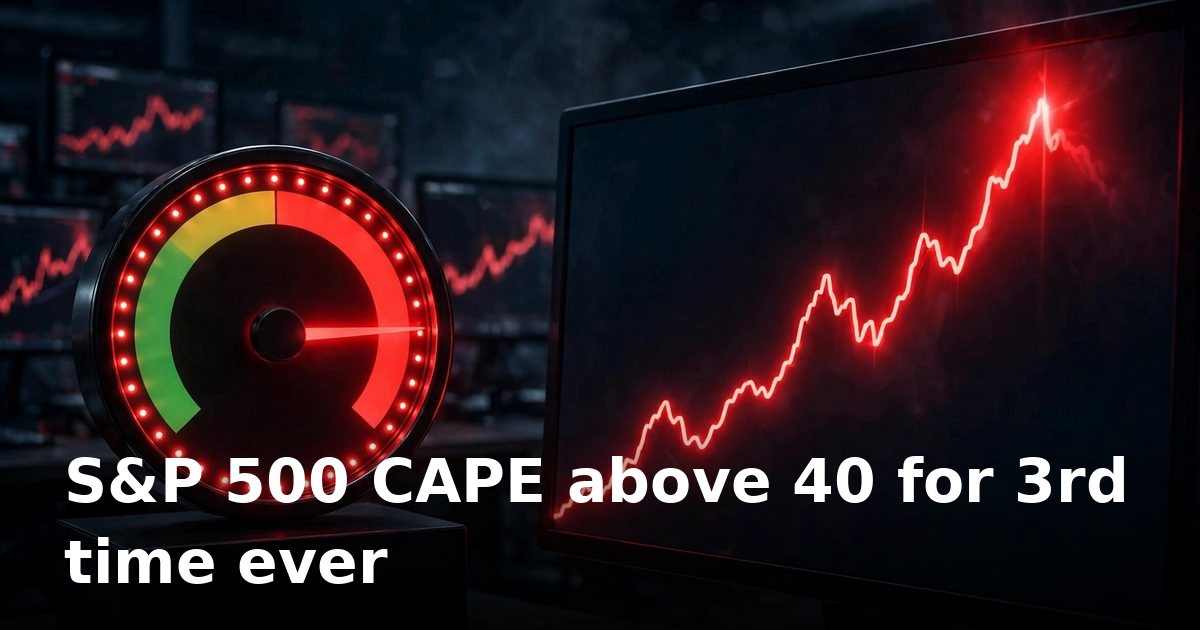

One gauge on Wall Street is flashing a signal it has given only twice before in 156 years of records. The S&P 500's Shiller price-to-earnings ratio — the CAPE — has held above 40 since May 2026. Only the dot-com bubble peak and the January 2022 top got there before.
The index sits at 7,742, a stone's throw from record highs. That is the point. New highs, on the same valuation extreme that preceded two historic wipeouts.
The CAPE compares the S&P 500 to ten years of inflation-adjusted earnings, which smooths out one-off profit spikes. Backtested to January 1871, the average multiple is 17.42. Today's reading of roughly 40.5 — 41.60 at the September 21 close, 42.84 at the bull-market high — means investors are paying 2.3 times the normal price for every dollar of decade-averaged earnings. The multiple has sat at more than double its long-run average for five months straight, after crossing the 40 line repeatedly last year and again early this year.
Why it matters
Valuation extremes do not call the next move. They call what comes after. The first episode started in January 1999. The gauge stayed lofty for nearly two years. It crested at 44.19 as that December ended. The dot-com bubble burst months later. By October 2002 the S&P 500 was down 49% from its peak and the Nasdaq 78% from its own.
The second episode lasted only days — the first week of January 2022. Even that brief brush was enough. The nine-month bear market that followed took a fifth off the Dow, a quarter off the S&P, and a third off the Nasdaq. This time the fuel is different: generative-AI infrastructure spending, profits that keep beating forecasts, record share repurchases, and a hot IPO market. Same multiple, different engine.
The bill for this rally is already enormous. The S&P has compounded roughly 21% a year for four years, more than double its century-long average of about 10%. Feeding that pace demands future earnings growth that may or may not arrive. That was exactly the bet the 1999 and 2022 peaks failed to collect on. For the indices desk, where yesterday's Nasdaq selloff showed how fast frothy tech can reprice, this is the backdrop behind the tape.
What to watch
- The October 27-28 Fed meeting: a hawkish surprise would hit premium multiples hardest, and the Fed's October signal points toward more tightening risk, not less.
- Third-quarter earnings from the AI build-out cohort. The buyback and capex stories have to keep beating to justify a 40-plus multiple.
- Margin debt and credit spreads. Stretched valuations plus rising leverage is the mix that historically turned corrections into bear markets.
- Breadth. If the index keeps holding near 7,742 while fewer stocks participate, the top gets heavier by the week.
MarketRadar take
The honest read is a barbell. Valuations this stretched have never been tolerated for long — two for two, both ended in bear markets. But this is a terrible market-timing tool. It says nothing about next week. The October 27-28 Fed meeting is the near-term trigger, since a hawkish surprise would land first on premium multiples. Bespoke's data shows the typical S&P downturn bottoms in 286 calendar days, while the average bull runs 3.6 times longer at 1,023 days. And Crestmont's research shows every rolling 20-year S&P period since 1900 ended positive. Elevated downside risk over the next 9-12 months — against a long-run record that punishes anyone who treats a valuation alarm as a sell signal.
| Episode | CAPE peak | Time above 40 | What followed |
|---|---|---|---|
| 1999–2000 | 44.19 (Dec 1999) | ~20 months | S&P -49%, Nasdaq -78% (to Oct 2002) |
| Jan 2022 | Just over 40 | Days | Dow -20%, S&P -25%, Nasdaq -33% (9 months) |
| May 2026–now | 42.84 | 5+ months and counting | Unwritten |