
Zones, not lines
Support is a price zone where buying has repeatedly stepped in and stopped a fall. Resistance is a price zone where selling has repeatedly stepped in and stopped a rise. Traders draw them as horizontal zones on a chart, not as exact lines, because real markets turn near a level rather than on it to the cent.
Think of support as a floor that has held before, and resistance as a ceiling that has held before. Neither is a law of nature. Both are simply places where, in the past, enough orders sat to turn the price around. That history is what makes other traders watch the same zones.
Why buyers step in at support
Three groups tend to buy near a support zone. Traders who missed the last bounce buy the dip, hoping for a repeat. Traders who sold near the top buy back to close their shorts. And traders who bought at the zone before add to a winning idea. Together, that demand can absorb selling and turn the price back up.
The more times a zone has held, and the more recent those holds are, the more traders watch it. A zone that held three times in the last month draws more orders than one that held once a year ago.
Why sellers step in at resistance
Resistance works as the mirror image. Traders who bought low sell into strength to take profit. Traders who bought at the top last time and have been waiting to get out at breakeven sell as price returns to their entry. And short sellers open new positions, betting the ceiling holds again. That supply can cap the rise.
A resistance zone weakens each time it is tested. Every test lets some sellers finish exiting, so the supply sitting there thins out. After several tests, a zone that once capped price for months can give way on the next push.
Role reversal: old resistance becomes new support
The most useful property of these zones is that they flip. When price finally breaks through resistance and holds above it, the traders who sold there regret it. On the next dip back to that zone, many of them buy, turning the old ceiling into a new floor. The same flip happens in reverse: broken support often acts as resistance on the way back up.
This is why traders pay close attention to retests. A breakout that holds above the old zone and then bounces off it on a retest is a stronger signal than a breakout alone, which can be a brief poke above the zone that fails within hours.
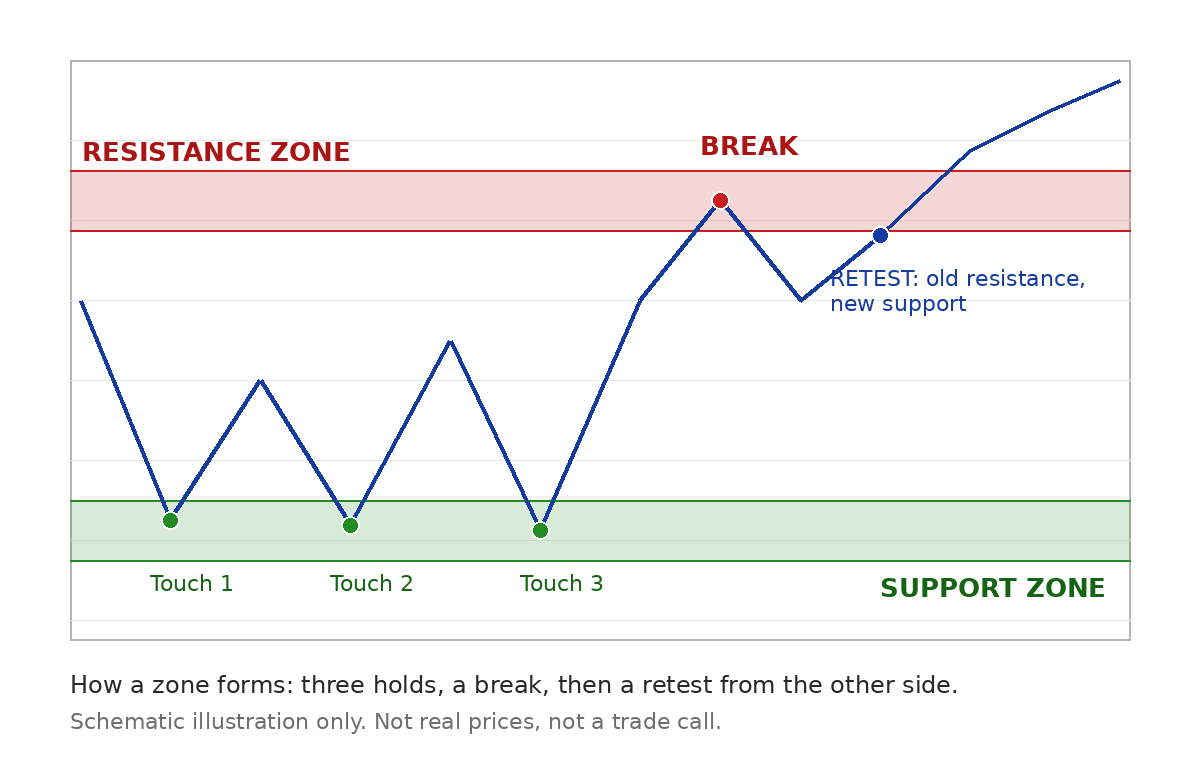
How a zone forms, touch by touch
A zone is not drawn from one bounce. It is earned, one touch at a time:
- First low. Price falls and bounces. On its own this is just a
low, not a zone. Nobody can know yet whether buyers will return.
- Second touch. Price falls back to the same area and holds
again. Now traders draw a band covering both lows. The zone exists, but it is still young.
- Third touch. Price returns a third time and holds again. Now
the zone is on many screens at once, and orders stack there before price even arrives. Each test also thins out the sellers who wanted out, so the zone can hold on thinner supply each time.
- The break. One day price closes through the zone above (for
resistance) and stays there. A brief poke past the zone that closes back inside is not a break. A close beyond it that holds is.
- The retest. Price comes back to the old zone from the other
side. If it holds there, the flip is confirmed: old resistance now works as support, or old support now works as resistance.
The diagram below shows the full sequence: three holds at support, a break through resistance, and a retest where the old ceiling becomes the new floor.
Real example: gold's demand zone for November 02-06, 2026
MarketRadar's weekly outlook for November 02-06, 2026, published October 31, mapped gold (XAUUSD) with a daily demand zone of 3,863.30-3,904.70 and a daily supply zone of 4,057.17-4,098.57. The week ended with gold at 3,892.84, inside the demand zone, after a week range of 3,884.00-4,077.87.
Read it as a zone, not a line. Price closed the week inside the band where buyers had stepped in before, not on one exact number. Above it, the outlook marked resistance at 3,900.00, 3,925.00 and 3,950.00. The zone logic from this guide applies directly: if the demand zone holds, the next levels to watch are those resistance marks; if price closes back below the zone, the zone has failed and the map changes. This is a reading of published levels, not a trade call. Full levels: Weekly Outlook: Gold, Bitcoin and Forex Key Levels for November 02-06, 2026.
Worked example: a $100 zone that flips (illustration)
The numbers below are an illustration, not a real asset or a trade call. They show the mechanics step by step:
- Three holds. An asset rises to $100 three times and falls back
each time. Traders mark $100 as resistance.
- The break. On the fourth push, price closes above $100 and
stays there for two sessions. The ceiling is broken.
- The retest. Price dips back to $100. Buyers who missed the
break step in, and the dip holds. Old resistance is now support.
- The stop placement. A trader buying the retest would place a
stop below the zone, not on it, because a brief dip under $100 that recovers is normal noise, while a close back below the zone says the flip failed.
The lesson: wait for the zone to prove itself. A touch is not a hold, and a break is not a flip until price defends the zone from the other side.
Key takeaways
- Support is a zone where buying has repeatedly stopped falls; resistance is a zone where selling has repeatedly stopped rises.
- Zones are areas, not exact lines, and they weaken with each test as supply or demand thins out.
- Broken resistance often becomes new support, and broken support often becomes new resistance.
- Retests matter more than first touches: a zone that holds from the other side confirms the flip.
- Stops go beyond the zone, not on it, because brief pokes past a level are common.