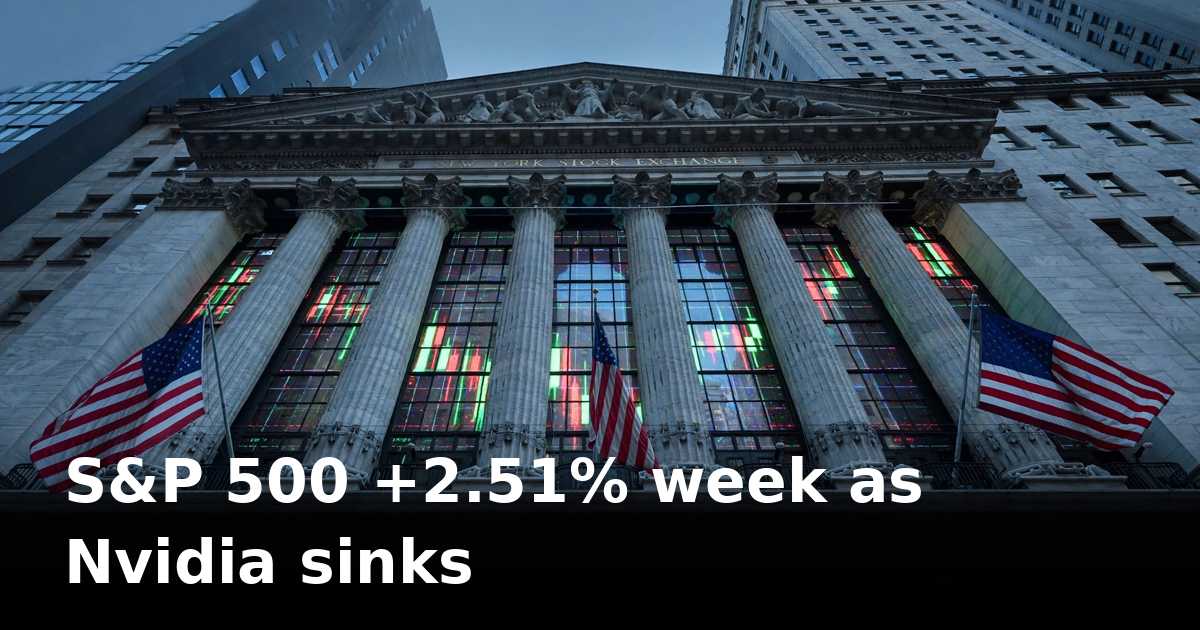
Shortages can fool a market. Dario Perkins of TS Lombard sent that warning to clients in a November 18 note. A bottleneck looks like demand outrunning supply. It can also sit just ahead of a glut. The S&P 500 today trades under the close that frames his warning. Tuesday's finish was 7,340.53, down 1.03% for a fourth straight losing session, the lowest close since July 29. The Nasdaq gave back 0.74% to 24,328.38, the Dow lost 1.64% to 50,759.42. Nvidia beat Wall Street after the bell, jumped about 5% in late trading, then turned negative by Wednesday morning, per Nasdaq.
Perkins tested the bull case against the dot-com bust's first year. The fit bothered him. March 10, 2000 marked the Nasdaq top. Six weeks later it had shed over a third. The Fed kept lifting rates: a quarter point in February, a quarter point again in March, then a half point in May. By mid-June the index had clawed back roughly 35%. Buyers had reasons. Dips had paid in 1997 and 1998. Profits were rising fast enough that rates looked beside the point. Cash moved toward profitable giants, Cisco, Oracle and Microsoft among them. The rebound failed as forecasts slid from September. The Nasdaq closed 2000 near half its March top. Cisco, the most valuable company on earth that March, had shed close to 90% by October 2002.
The weak link was the customer list. The giants sold to young dot-coms and telecom outfits. Their money came from flotations, venture funds and high-yield debt. When that money stopped, orders faded a few months later. Shortage flipped to glut inside half a year. The Fed read it late too: meeting transcripts from that autumn show Greenspan still expecting productivity to hold up, per Perkins. The downturn was later dated to March 2001.
The 2000 parallel, in numbers
In 2000 the Nasdaq traded above 80 times earnings; the figure today is near 30, per TS Lombard.
| Measure | 2000 bust | 2026 selloff |
|---|---|---|
| Nasdaq, first leg | Down over a third within six weeks | About 12% below its high |
| Bounce | Roughly 35% higher by mid-June | Nvidia up about 5% after hours, negative by Wednesday |
| Nasdaq P/E | Above 80 | Near 30 |
| Year-end | Near half its March top | In progress: S&P 500 at 7,340.53, lowest since July 29 |
| Leaders' customers | Start-ups on flotations, venture cash, high-yield debt | AI builders on debt: Oracle carries about $169B |
Why it matters
The damage stays contained at index level. The Nasdaq sits about 12% below its high. The equal-weighted version of the index even set a fresh high while the selloff ran, per HTX Insights. October gave the widest monthly gap between the equal-weighted and cap-weighted S&P 500 since April 2009: 5.7 percentage points. The pain sits in the chain.
Nvidia closed Monday at $156.14, about 35% below its October 6 record, per CNN. It finished Tuesday at $155.46, down a further 0.44%. Oracle closed Tuesday at $115.00, down 3.43% on the day and 54.0% under the $250.25 top it set within the past year. CoreWeave sits roughly 70% under its June 2025 top. The chip index, the Philadelphia Semiconductor Index, has given back about 40% since its June 22 top of 14,634, implying a level near 8,780.
The cost of insuring Oracle's debt jumped. Its five-year swap widened to 295 basis points in mid-October, from about 58 a year earlier. Debt has reached about $169 billion. Capital spending hit $55.7 billion in fiscal 2026 and should reach $91.9 billion this fiscal year, with free cash flow expected at minus $23.7 billion, per HTX Insights. Monday's session showed the same pattern: Micron and Intel each lost over 7%, while consumer staples, the only gaining sector, rose 0.3%. Fresh US export controls added a second drag, hitting Southeast Asia data-centre stocks on Tuesday.
What to watch
- Anthropic's IPO tests appetite for AI paper. The planned valuation sits near $1.4 trillion, at $70 to $78 a share, per CNBC.
- Cloud spending plans face their next test. The four big spenders guide a combined $720 billion to $745 billion for 2026, per HTX Insights.
- The Fed's path: it raised rates on September 16 and held at 3.75% to 4% on October 28.
- Wednesday's close against Tuesday's 7,340.53: the 21:15 PKT snapshot put the S&P 500 at 7,310 (-0.42%), the Dow at 50,149 (-1.20%) and the Nasdaq at 24,349 (+0.09%).
Key points
- S&P 500 closed Tuesday at 7,340.53, down 1.03%, its lowest close since July 29 and a fourth straight losing session. The Nasdaq fell 0.74% to 24,328.38 and the Dow lost 1.64% to 50,759.42.
- Nvidia beat on earnings: adjusted EPS of $2.68 against $2.48 expected, revenue of $115.84 billion against $109.10 billion, guidance near $130 billion for the fourth quarter. The shares still ended Tuesday down 0.44% at $155.46.
- Perkins, in a November 18 note for TS Lombard, says today's bull case matches the arguments heard in mid-2000, when the Nasdaq bounced 35% and ended the year near half its peak.
- The selloff sits in AI names: Nvidia about 35% below its October record, Oracle 54.0% under its $250.25 top, CoreWeave roughly 70% under its June 2025 top, the chip index down about 40% since June.
MarketRadar take
The index tape says correction. The AI tape says something deeper. The gap between the two is the trade to watch. The equal-weighted version closed the selloff week at a record while the cap-weighted index slid to its lowest close since July. Money is rotating, not leaving. What decides the next leg is the financing chain Perkins flags: if cloud spending plans hold, the 2000 parallel stays a warning; if they crack, the earnings that still look strong become the last numbers to turn.